Where Data Comes to Life
Explore the power of data-driven creativity in our Experience Area. Interact with dynamic visualizations and real-time insights, and see how we blend digital marketing, data analytics, and machine learning to reveal actionable opportunities. Dive in, explore, and discover how our approach can drive your business forward.
Browse by the section of your interest
1. Machine Learning:Python+Tableau+Streamlit
Geolocation of sentiment towards certain artistic activities in Spain: Keywords vs. Places where they are expressed.
Interact with the graph to analyze the rating or positive, negative or neutral sentiment, or the keyword or place name.
Explanation of the graphic representation
This graph is one of the parts of a project that analyzes through machine learning the sentiments towards the opinions of users in certain cultural environments (museums, art schools, galleries, etc.) to predict how these opinions will behave in future years and allow planning targeted marketing campaigns for the development of exhibitions, courses, events, etc., as an assistant to decision making.
2. Dashboard representation:Tableau+Looker Studio
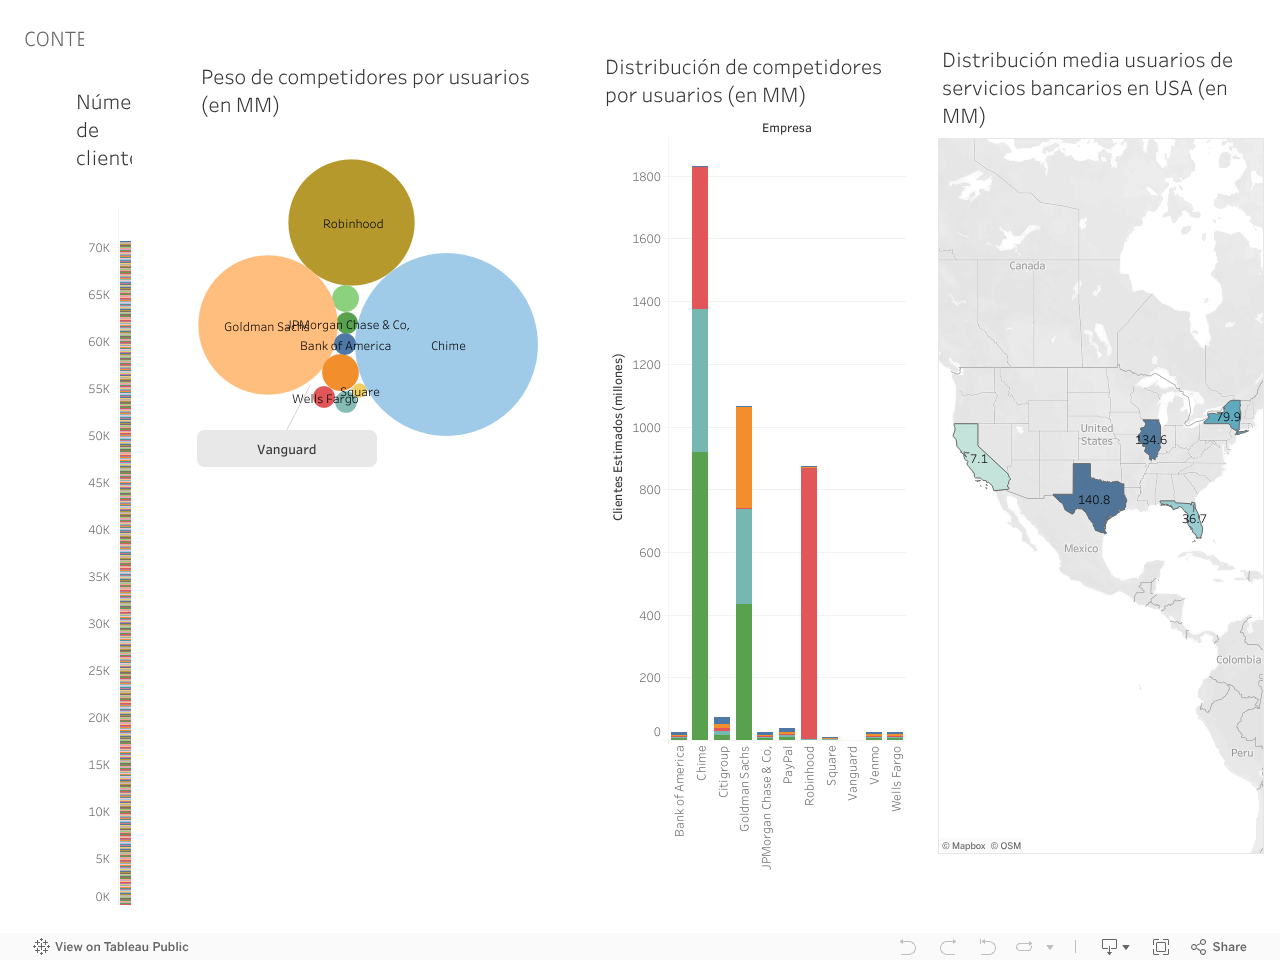
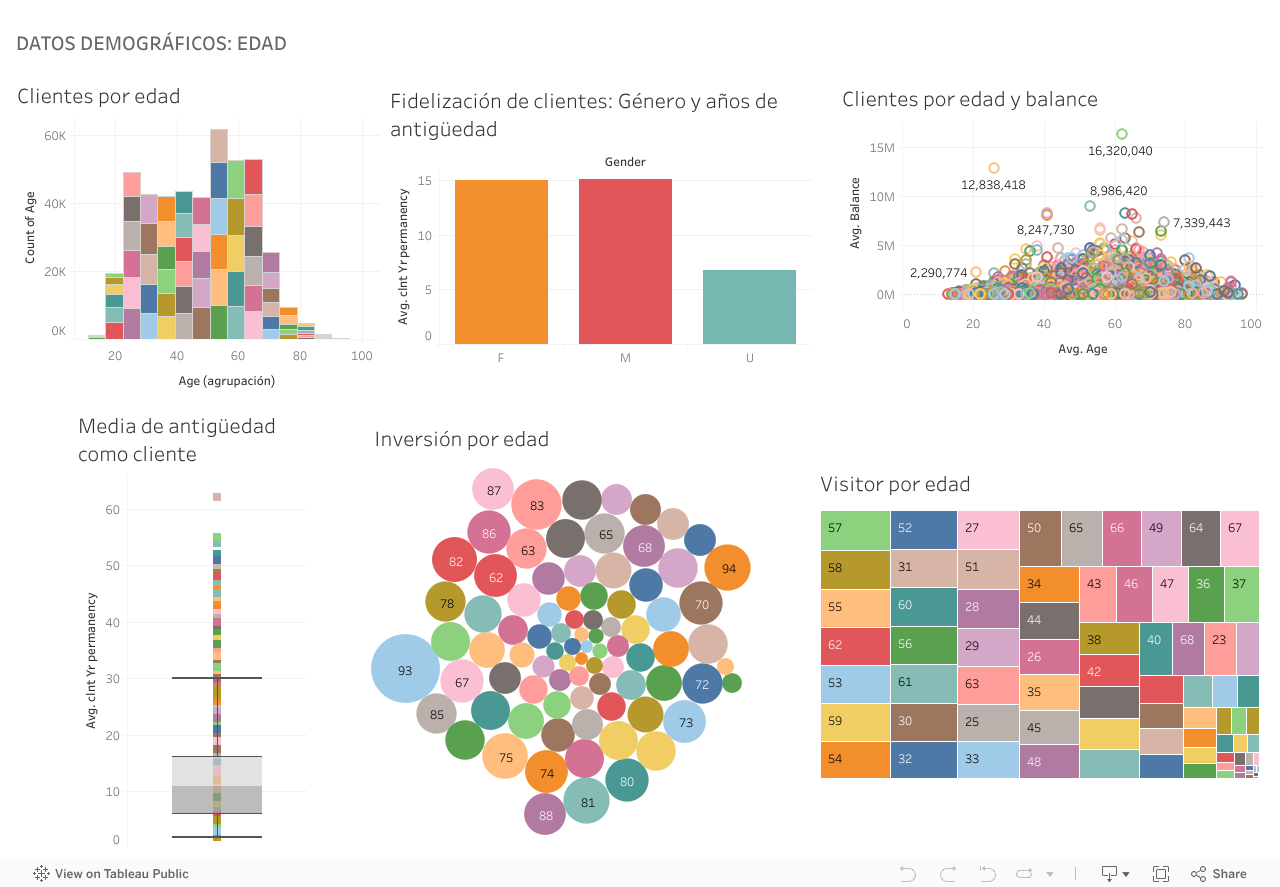
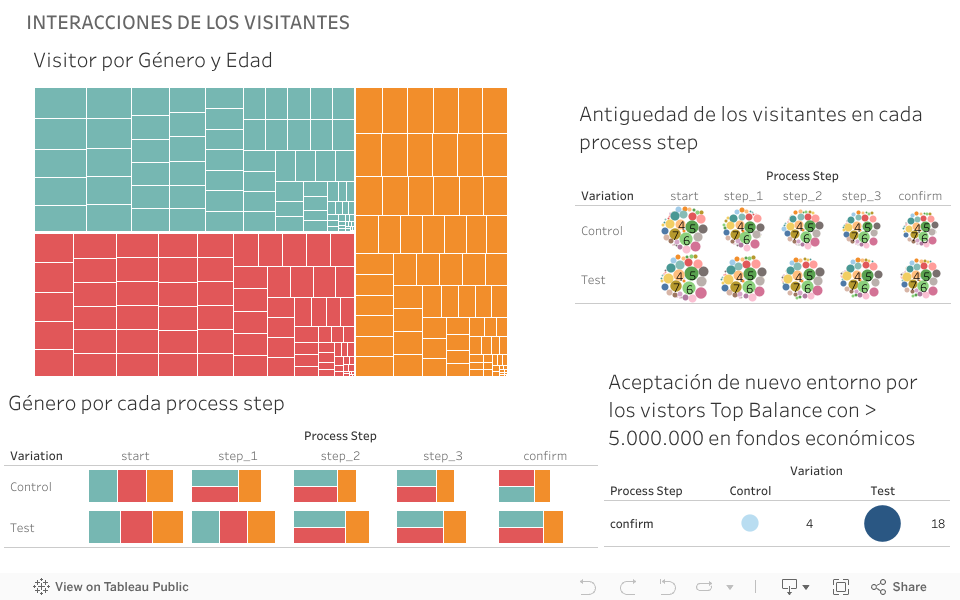
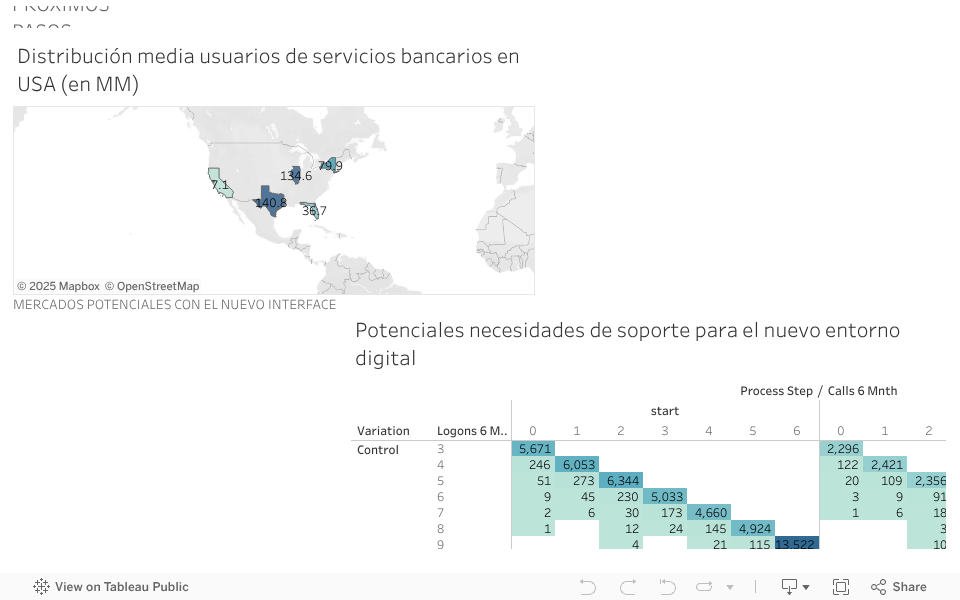
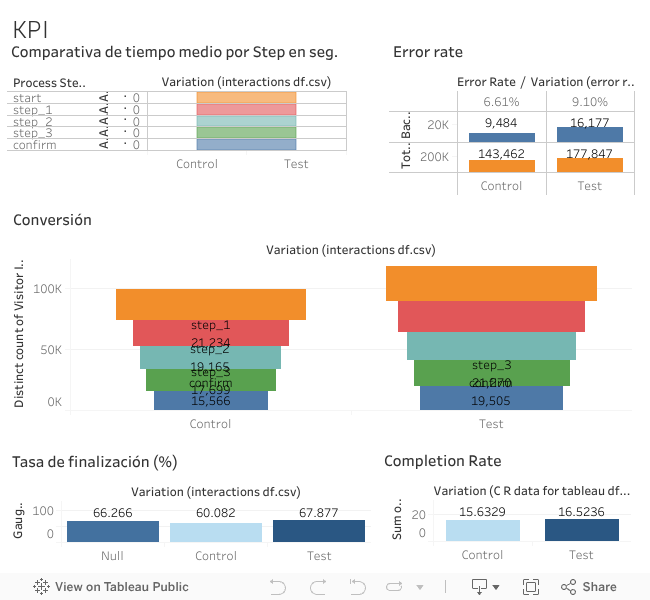
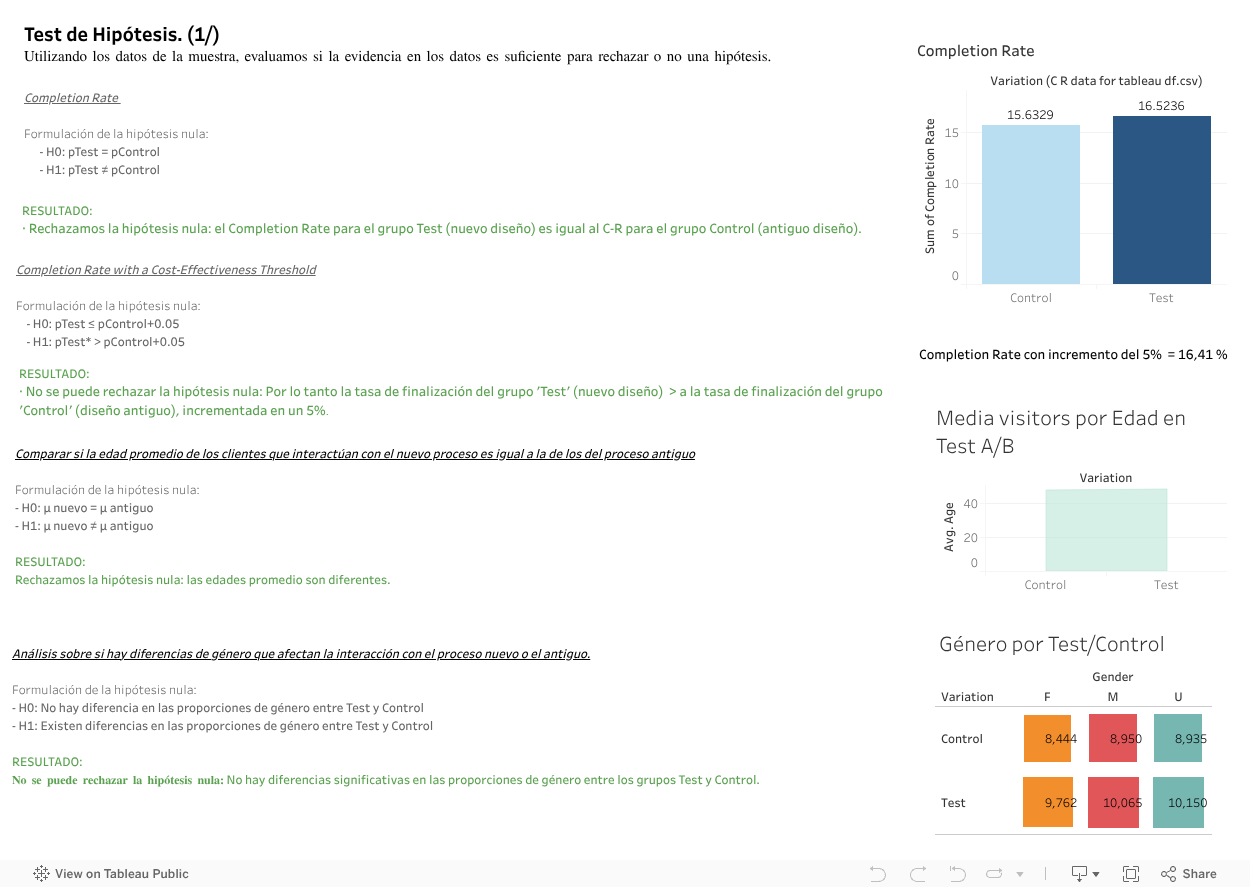
Tableau: Results analysis of the A/B test of the US digital financial broker Vanguard.
Interact with the graph to analyze Vanguard’s initial competitive positioning, socio-demographic positioning, interactions with the new website and final A/B test KPI’s.